
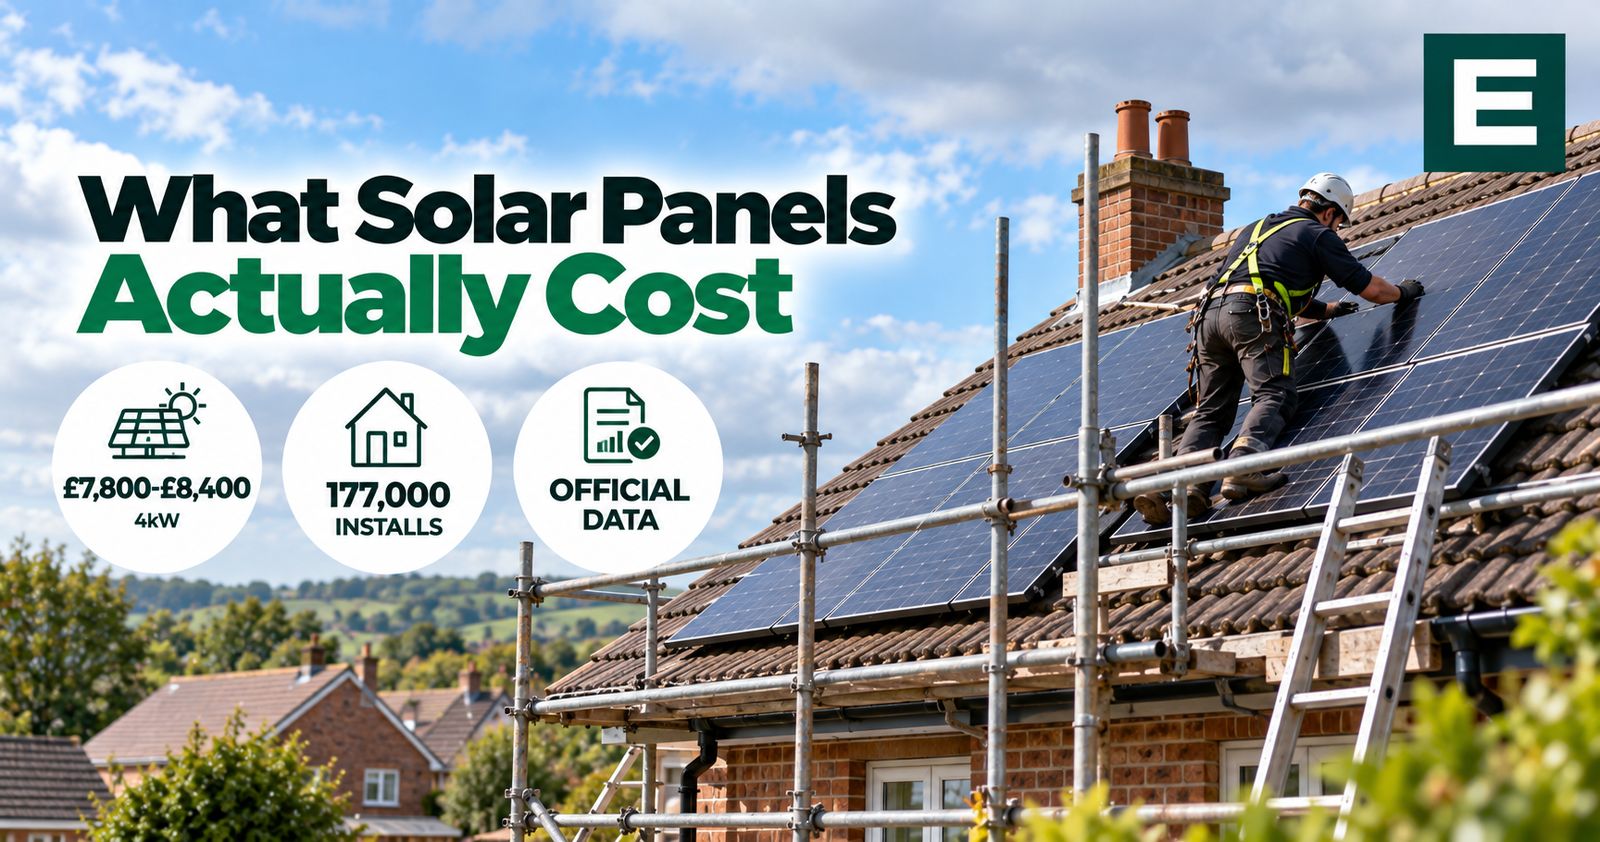
A 4kW solar system costs between £7,800 and £8,400 installed, according to government data covering roughly 177,000 domestic installations. A 6kW system runs £9,900 to £10,700. There is no grant, so that is what you pay.
Those figures are higher than almost every cost guide you will find, including the ones that cite the same dataset. This page explains where they come from, why the published averages disagree with each other, and what actually moves a quote.
What people actually paid
Most solar cost guides give you a range based on quotes and estimates. There is a better source and hardly anyone uses it properly.
DESNZ publishes Solar PV (photovoltaic) cost data drawn from the MCS Installation Database, which records every certified installation in Great Britain. The 2025/26 release, published on 28 May 2026, covers 176,894 domestic installations with 98% coverage. These are prices actually paid by real households.
The data is published as cost per kilowatt of capacity installed:
| System size band | Mean cost per kW | Installations |
|---|---|---|
| All domestic installations | £1,962 | 176,894 |
| 0 to 4 kW | £2,096 | 107,137 |
| 4 to 10 kW | £1,785 | 64,487 |
| 10 to 50 kW | £1,415 | 5,270 |
DESNZ, Solar PV cost data 2025/26, declared net capacity basis. Domestic installations, Great Britain.
The pattern is the important bit: cost per kilowatt falls sharply as systems get larger. A small system carries the same scaffolding, the same day’s labour and much the same electrical work as a larger one, spread across fewer kilowatts.
The measurement problem nobody explains
Here is why the published averages disagree, and it is not because anyone is lying.
DESNZ measures capacity two ways. Declared net capacity is the maximum an installation could export to the grid at any one time. Total installed capacity is the total it could generate at any one time. TIC is usually the higher number, so cost per kilowatt of TIC comes out lower.
The department publishes both, and states that TIC figures are typically 6 to 12% lower than DNC ones. On the 2025/26 domestic data the gap is 9.7%.
| Domestic, 2025/26 | DNC basis | TIC basis |
|---|---|---|
| All installations | £1,962/kW | £1,772/kW |
| 0 to 4 kW | £2,096/kW | £1,955/kW |
| 4 to 10 kW | £1,785/kW | £1,645/kW |
Same year, same database, same houses. Two different answers.
It gets more awkward. The two datasets sort installations into size bands using their respective capacity measures, so the same house can land in different bands depending on which file you open. DESNZ gives the example of an installation with a DNC of 3.9kW but a TIC of 4.1kW: it counts in the 0 to 4kW group in one dataset and the 4 to 10kW group in the other.
That is not a marginal effect. The 0 to 4kW band holds 107,137 domestic installations on the DNC basis and 82,431 on the TIC basis. Around 25,000 households move up a band purely because of the measure used.
So when a site tells you the average cost of a 4kW system, the honest response is to ask which 4kW they mean. We use DNC as our headline because it is directly comparable with previous years, and give the TIC figure alongside. DESNZ is moving towards TIC as its general basis, but that series is still classed as Official Statistics in development.
What that means in pounds
Cost per kilowatt is what the data says. What people search for is what a system costs. Converting requires multiplying the band mean by the system size, so these are good central estimates rather than precise prices.
| System size | Installed cost | Roughly |
|---|---|---|
| 3 kW | £5,900 to £6,300 | 7 to 8 panels |
| 4 kW | £7,800 to £8,400 | 9 to 10 panels |
| 5 kW | £8,200 to £8,900 | 11 to 13 panels |
| 6 kW | £9,900 to £10,700 | 14 to 15 panels |
| 8 kW | £13,200 to £14,300 | 18 to 20 panels |
Calculated by us from the DESNZ band means. The lower figure uses the TIC basis, the higher the DNC basis. Panel counts assume 430W panels and are indicative.
These are higher than the ranges most sites quote. The common figure for a 4kW system is £6,000 to £8,000. If you have been told to budget £6,000, the official data says most households paid more than that.
One caution on our own arithmetic. DESNZ publishes a mean for each band, and cost per kilowatt falls within a band as well as between bands. So applying a band mean at the top of its range overstates slightly, and at the bottom understates. Treat these as the middle of a distribution, not a quote.
Cost per square metre and per panel
DESNZ does not publish costs by area or by panel, but both are easy to derive. A typical modern domestic panel is around 430W and measures about 1.72m by 1.13m, roughly 1.95 square metres. That works out at about 4.5 square metres of panel per kilowatt.
On the 2025/26 domestic averages, that gives an installed cost of roughly £390 to £430 per square metre of panel, or about £760 to £840 per panel. The lower figure uses the TIC basis, the higher the DNC basis.
These are installed costs spread across the panel area, covering scaffolding, inverter, wiring and labour as well as the panels themselves. They are not the price of the panels alone, and they are our own calculation, so treat them as a way of sanity-checking a quote rather than a price to expect. Smaller systems come out higher per square metre for the same reason they cost more per kilowatt.
The cheapest solar you will ever buy
Look at the 4kW and 5kW rows again. A 5kW system costs roughly £400 to £550 more than a 4kW one.
That is not because 5kW is only slightly bigger. It is because 5kW falls into the 4 to 10kW band, where the mean drops from £2,096 to £1,785 per kilowatt. Crossing the band boundary buys you a cheaper rate on the whole system.
That extra kilowatt will generate somewhere around 850 to 950 kWh a year in most of the UK. At the current import price of 26.32p, that is worth up to around £225 a year if you use it all, and less if you export a good deal of it. Even on conservative assumptions, the marginal kilowatt pays for itself several times faster than the system as a whole.
So if your roof takes it, going a little larger is usually the best value decision in the whole project. The constraint is roof space and, in some cases, what your network operator will allow you to export.
Are solar prices still falling?
Yes, but more slowly than the headlines suggest, and from a higher starting point than most people assume. Domestic cost per kilowatt fell between 2024/25 and 2025/26 on both measures.
| Domestic, all installations | 2024/25 | 2025/26 | Change |
|---|---|---|---|
| DNC basis | £2,063/kW | £1,962/kW | down 4.9% |
| TIC basis | £1,844/kW | £1,772/kW | down 3.9% |
A consistent direction on both bases makes this a safe claim rather than an artefact of one measure. Volumes rose sharply at the same time, from 155,159 domestic installations in the analysis to 176,894.
The domestic split only goes back two years. The longer series covers all small scale installations, domestic and non-domestic together, and it puts that fall in context.
| Year | 0 to 4 kW, mean per kW | 4 to 10 kW, mean per kW |
|---|---|---|
| 2020/21 | £1,699 | £1,722 |
| 2021/22 | £1,893 | £1,605 |
| 2022/23 | £2,372 | £2,104 |
| 2023/24 | £2,392 | £2,221 |
| 2024/25 | £2,110 | £1,846 |
| 2025/26 | £2,008 | £1,770 |
DESNZ, Solar PV cost data 2025/26, annual table, declared net capacity basis, all small scale installations, Great Britain.
Three things stand out.
Prices peaked in 2023/24 and have come down since. Small systems are 16% cheaper per kilowatt than at the peak, and systems between 4 and 10kW are 20% cheaper. The total installed capacity series, which only starts in 2023/24, shows the same direction.
Small systems are still well above where they were. A system under 4kW costs 18% more per kilowatt than in 2020/21. Systems between 4 and 10kW are back within 3% of their 2020/21 level. That is the band effect again: the larger the system, the more of the post-2022 rise has already unwound.
The fall has slowed. Within 2025/26, the mean for small systems in the last three months of the year was about 3% below the first three. Waiting a year for prices to fall further is a bet on a few per cent.
That matters because of VAT. 0% VAT on domestic solar runs until 31 March 2027, after which the rate is expected to return to 5%. On an £8,000 system that is around £400, which is roughly a full year of price falls at last year’s pace. If you are going to install in the next year or so, installing before April 2027 is likely to be cheaper than waiting.
Where you live changes the price
DESNZ also publishes regional figures. These cover all small scale installations rather than domestic only, so read them as a guide to regional variation rather than as household prices. We take the regional data further, including how the ranking moves between the two measures, in our solar costs by region analysis.
| Region | Mean cost per kW, 2025/26 |
|---|---|
| North East | £1,819 |
| Wales | £1,867 |
| East of England | £1,872 |
| Scotland | £1,877 |
| Yorkshire and the Humber | £1,892 |
| North West | £1,934 |
| West Midlands | £1,940 |
| East Midlands | £1,965 |
| South East | £1,971 |
| London | £2,007 |
| South West | £2,043 |
DESNZ, Solar PV cost data 2025/26, declared net capacity basis, all installation types.
Two things stand out. The South West is the most expensive region, above London, which is not what anyone would predict. And the spread from cheapest to dearest is around 12%, which on a 4kW system is roughly £900.
A caution on reading too much into that ranking. On the TIC basis the order changes substantially and the South West falls to mid-table. Regional differences are real but smaller than the measurement effect, which is a reason to treat any single regional figure carefully, ours included.
What is in the price, and what is not
DESNZ publishes total installed cost and does not break it down, so anyone giving you a percentage split for panels against labour is estimating. What we can tell you is what a complete quote should cover, and what commonly sits outside it.
Should be included: panels, mounting system, inverter, electrical work and isolation, scaffolding, MCS certification, DNO notification, and the handover documents you need to apply for export payments.
Often extra, and worth asking about:
- Scaffolding on difficult access. Usually included, but a rear roof with no side access can add several hundred pounds.
- A consumer unit upgrade, if your existing board cannot accommodate the installation.
- Bird protection mesh. Cheap at the time of installation, expensive later once scaffolding has to come back.
- Optimisers or microinverters where the roof is shaded. These add cost and are sometimes quoted as standard when they are not needed.
- A battery, which is a separate decision and a separate cost. Be wary of a quote that bundles one without discussing whether you need it.
And one cost that appears in no quote: the inverter will need replacing before the panels do, typically after ten to fifteen years. Panels are usually warranted for twenty five. That replacement is real money and it rarely features in the payback figures you will be shown.
What this means for your quotes
Three practical points.
Compare on total installed price, not price per panel. Panel wattage varies, so a quote for ten panels tells you nothing until you know the system size in kilowatts.
A quote well below these figures deserves a question rather than a celebration. The data covers 177,000 installations at 98% coverage. A price substantially under the band mean usually means something has been left out, and the commonest omissions are scaffolding, the DNO application and bird protection.
Ask for the system size in kW and the estimated annual generation in kWh. Those two numbers let you do your own arithmetic. Without them you are comparing sales documents rather than systems. Our guide to choosing a solar installer covers the rest of the checks, including why an installer without MCS certification can cost you your export payments.
Knowing the cost is only half the question. Whether it pays depends far more on how much of your own generation you use than on what you paid for the panels, and we work through that in whether solar is worth it. To run the numbers for your own roof, use the solar payback calculator.
Frequently asked questions
These come up most often when people start getting solar quotes.
How much do solar panels cost in the UK?
Around £7,800 to £8,400 for a 4kW system and £9,900 to £10,700 for 6kW, based on DESNZ data covering roughly 177,000 domestic installations in 2025/26. There is no grant for solar, so that is the amount you pay.
Why do published solar costs vary so much?
Partly because most guides use quotes rather than recorded prices, and partly because the official dataset is published on two different capacity measures that produce figures around 10% apart. A cost per kilowatt figure means little unless you know which measure it used.
Is solar cheaper per kW on a bigger system?
Considerably. The mean is £2,096 per kW for systems up to 4kW and £1,785 per kW between 4 and 10kW. Fixed costs like scaffolding and labour spread across more capacity.
Are solar panel prices going up or down?
Down, but slowly. Domestic cost per kilowatt fell 4 to 5% between 2024/25 and 2025/26, on both measures DESNZ publishes. Prices peaked in 2023/24 and small systems are still around 18% above their 2020/21 level. With 0% VAT due to end on 31 March 2027, waiting for further falls is unlikely to save money.
How much does solar cost per square metre?
Roughly £390 to £430 per square metre of panel installed, or about £760 to £840 per panel, on the 2025/26 domestic averages. That is our own calculation assuming a typical 430W panel of about 1.95 square metres, and it covers the whole installation, not the panels alone.
Is there a grant for solar panels?
Not a universal one. There is no equivalent of the Boiler Upgrade Scheme. 0% VAT applies until 31 March 2027, and means-tested schemes such as ECO4, Nest in Wales and the Home Energy Scotland Grant and Loan can include solar for eligible households.
Where is solar cheapest in the UK?
On the 2025/26 figures the North East, Wales and the East of England are at the lower end, and the South West, London and the South East at the higher end. The spread is around 12%, though the ranking shifts depending on which capacity measure is used.
Last updated 15 October 2026. Installation costs taken from DESNZ Solar PV cost data, 2025/26 release published 28 May 2026, drawn from the MCS Installation Database and covering England, Scotland and Wales. Figures are presented on the declared net capacity basis unless stated, with total installed capacity figures shown alongside. The price history uses the DESNZ annual table, which covers all small scale installations rather than domestic only. System prices in pounds, and costs per square metre and per panel, are our own calculation from the DESNZ band means and are flagged as such; the per square metre and per panel figures assume a 430W panel of about 1.95 square metres. Energy prices from the Ofgem price cap for 1 October to 31 December 2026. Written by Ben Jardine.