
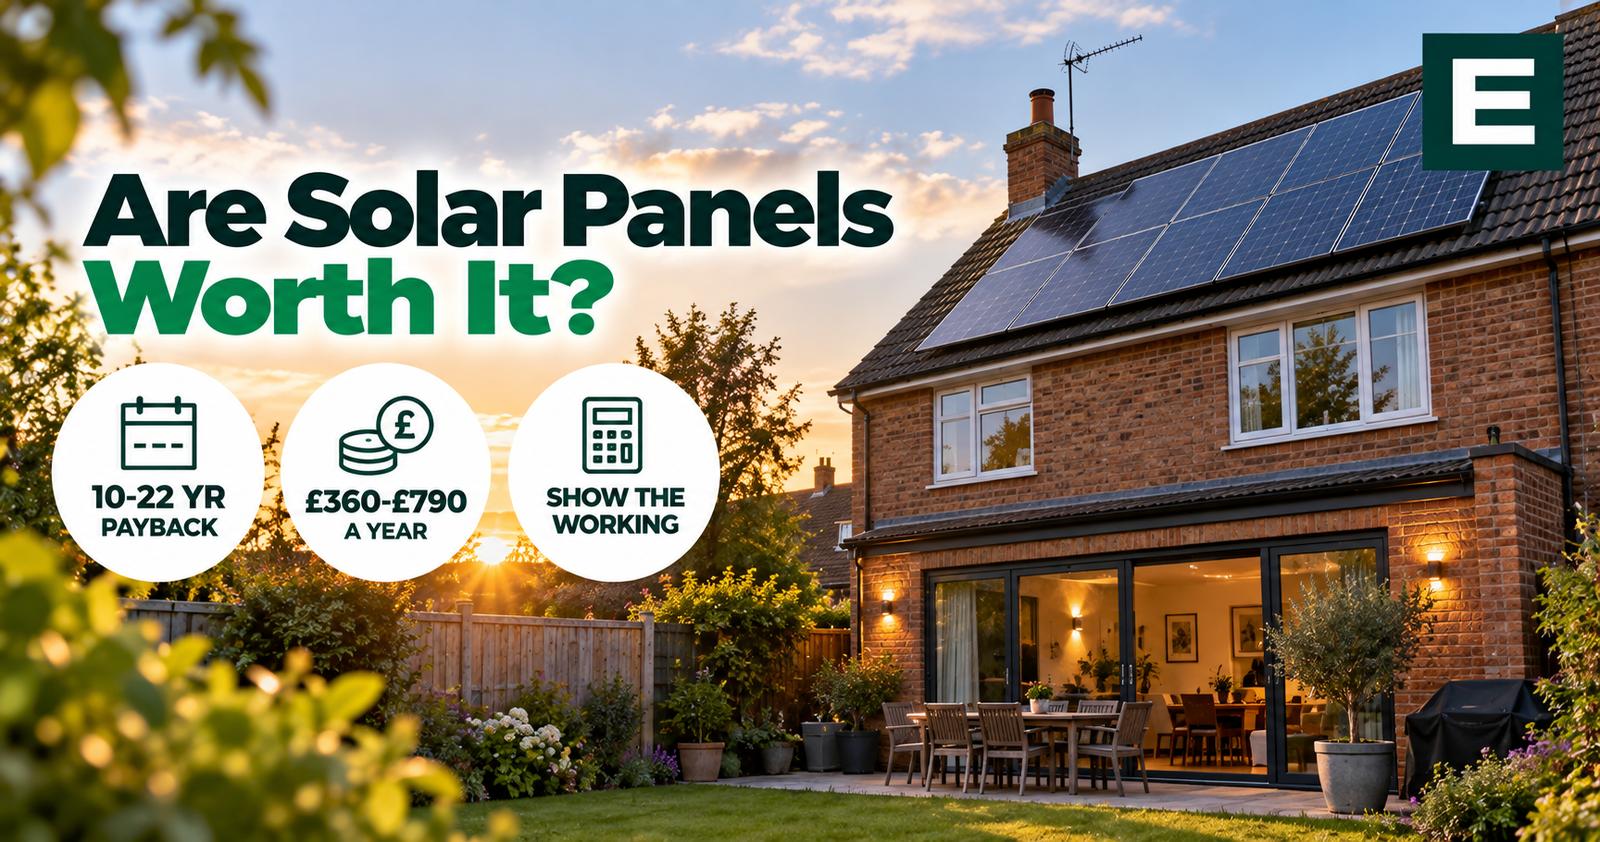
For most UK households with a decent roof, yes. But payback takes considerably longer than you have probably been told: on our arithmetic, somewhere between 10 and 22 years depending on three variables, against the six to ten years most guides quote.
This page shows the working rather than asserting a figure, so you can redo it with your own numbers when prices change.
The three numbers that decide it
Everything turns on these, and only one of them is about the panels.
- How much your roof generates. Set by location, orientation, pitch and shading.
- How much of that you use rather than export. Called self-consumption, and it is the biggest single variable.
- What you are paid for the rest. Your export tariff, which ranges from about 3p to 16p per kWh.
Two households with identical systems, identical roofs and identical bills can have payback periods a decade apart on points two and three alone. Any guide giving you a single payback figure without asking about your daytime occupancy is guessing.
What your roof will actually generate
MCS-certified installers calculate this using a standard method, MIS 3002, and the formula is simple:
System size in kWp × Kk × shade factor = estimated annual kWh
Kk is the annual kilowatt hours per kWp for your specific location, orientation and roof pitch, taken from tables based on solar data from the European Commission’s Joint Research Centre. The shade factor is a reduction for anything that shades the array.
The regional spread is wide. On MCS figures, a south-facing roof at 40 degrees produces around 1,132 kWh per kWp in Brighton and 837 kWh per kWp in Inverness. The Energy Saving Trust cites 850 to 950 kWh per kWp for England and Wales.
| System size | Annual generation, typical range |
|---|---|
| 3 kWp | 2,200 to 2,900 kWh |
| 4 kWp | 2,900 to 3,800 kWh |
| 5 kWp | 3,600 to 4,700 kWh |
| 6 kWp | 4,300 to 5,700 kWh |
Our calculation from published Kk ranges. The lower end reflects northern Britain and imperfect orientation, the upper end southern England, south-facing and unshaded.
The useful thing to ask for. MCS requires installers to provide the assumptions behind their generation estimate. So ask for the Kk value and the shade factor they used. Those two numbers let you check their arithmetic yourself, and a quote that cannot produce them is not an MCS-standard calculation.
Self-consumption, the number nobody asks about
Here is why this matters more than anything else on the page.
Under the Ofgem price cap for 1 October to 31 December 2026, importing electricity costs around 26.32p per kWh. Export rates run from about 3p to 16p.
So a unit you generate and use is worth 26.32p. The same unit exported might be worth 4p. Using your own generation is worth between one and a half and six times as much as selling it.
Self-consumption typically runs somewhere between 30% and 70% depending on the household. What moves it:
- Being at home during the day. Retired, working from home, young children. This is the single biggest factor and it is nothing to do with your roof.
- When you run appliances. Dishwasher, washing machine and immersion heater during daylight rather than in the evening. Free to change and worth more than most people expect.
- An electric car charged at home during the day. Transforms self-consumption.
- A battery, which stores daytime surplus for evening use. Effective, but it has to earn its own cost, which is a separate question.
The awkward part: solar generates most in the middle of the day in summer, and UK households use most electricity on winter evenings. The mismatch is why self-consumption is rarely high without deliberate effort.
The arithmetic
A 4kWp system, installed cost £8,100, which is the midpoint of the official range on our solar cost page. Annual generation 3,400 kWh. Import price 26.32p.
| Self-consumption | Export at 4p | Export at 8p | Export at 16p |
|---|---|---|---|
| 30% | £364 a year 22 year payback |
£459 a year 18 year payback |
£649 a year 12 year payback |
| 50% | £515 a year 16 year payback |
£583 a year 14 year payback |
£719 a year 11 year payback |
| 70% | £667 a year 12 year payback |
£708 a year 11 year payback |
£790 a year 10 year payback |
Our calculation. Assumes no change in electricity prices or export rates, which is unrealistic but keeps the comparison clean.
Three things fall out of that table.
The range is 10 to 22 years, not the six to ten commonly quoted. Even the best cell here is a decade.
Self-consumption matters most at low export rates. Going from 30% to 70% self-consumption on a 4p tariff cuts payback by ten years. On a 16p tariff it saves two.
Export rate matters most when self-consumption is low. If you are out all day, your tariff choice is the main lever you have.
So the advice depends on your household rather than being universal. Out all day, chase the export rate. At home during the day, shift your usage and the tariff matters less.
Run it for your own house
That table uses a 4kWp system in an average location. Yours will differ, and the variables that move the answer most are the ones only you know.
Our solar payback calculator takes the same arithmetic set out on this page and lets you put your own figures into it: system size, region, roof direction, daytime occupancy, export rate and the actual price on your quote. It shows every step, so you can see which assumption produced which number rather than taking ours on trust.
It asks for nothing in return. No email, no postcode, no phone number.
What these figures leave out
Being straight about the limits of our own arithmetic.
Working against solar:
- The inverter will need replacing, typically after ten to fifteen years, against a twenty five year panel warranty. That is real money inside the payback period and it appears in almost no published calculation, including the ones showing six year paybacks.
- Panels degrade, losing output slowly over their life. Modest, but it means year twenty does not match year one.
- Money has a cost. £8,100 in a savings account earns something. A payback calculation that ignores this flatters solar.
Working for solar:
- Electricity prices rise over time. Every increase makes your self-consumption more valuable and shortens payback. This is the strongest argument for solar and it is the one thing our table deliberately excludes, because forecasting it would be guesswork.
- 0% VAT until 31 March 2027, after which the rate is expected to return to 5%. On an £8,100 system that is around £400.
- Panels outlast the payback. Even at twenty years, a twenty five year warranted system spends its last years generating free electricity.
Those two lists do not cancel out neatly, and anyone claiming precision here is overstating what can be known.
How solar compares with a heat pump
Worth saying plainly, since we have been sceptical about heat pump economics elsewhere on this site.
A heat pump at a seasonal efficiency of 3.0 delivers heat at about 8.8p per kWh against 9.4p for a gas boiler. That margin is thin enough that a poorly designed system loses money, and we have said so.
Solar is different. There is no equivalent way for it to fail: the panels generate, and every unit you use displaces one at 26.32p. The economics are slower than advertised but they are far more robust. A badly optimised solar installation still pays, eventually. A badly designed heat pump may not.
That is not an argument against heat pumps, which do things solar cannot. It is an argument for being clear-eyed about which of the two is the safer financial decision.
When solar is not worth it
Significant shading. The shade factor goes straight into the generation calculation, and a chimney or tree can take a large bite. Optimisers help and cost more.
A north-facing roof with no alternative. The output penalty changes the answer.
A roof needing work within ten years. Removing and refitting an array is expensive. Do the roof first.
Moving within a few years. As with heat pumps, there is no reliable evidence the cost is recovered in sale price.
Very low electricity use. If you use 1,500 kWh a year, you will export most of what you generate and the arithmetic weakens considerably.
The short version
Solar is worth it for most UK homes with an unshaded roof facing somewhere between south east and south west, provided you are planning to stay put. Payback is realistically ten to twenty years rather than the six to ten usually advertised, and rising electricity prices will probably shorten that.
The two decisions that move the number most are free: shift your electricity use into daylight hours, and choose your export tariff deliberately rather than accepting the default. Neither costs anything and together they are worth more than any discount you will negotiate on the installation.
Run the numbers for your own roof with our solar payback calculator. For what a system costs, see what solar panels actually cost. For export tariffs, see solar export rates and the Smart Export Guarantee. And before you sign anything, choosing a solar installer covers what to verify.
Frequently asked questions
These come up most often when people are weighing up a quote.
What is the payback period on solar panels in the UK?
Realistically ten to twenty two years on current prices, depending on how much of your generation you use and what export rate you are on. Published figures of six to ten years generally assume high self-consumption, a good export tariff, and no inverter replacement.
How much will solar panels save me a year?
On a 4kWp system, roughly £360 to £790 depending on self-consumption and export rate. The spread is wide because those two variables matter more than the system itself.
What is self-consumption and why does it matter?
It is the proportion of your generation you use rather than export. It matters because a unit used is worth 26.32p while a unit exported may be worth 4p. Raising self-consumption is the cheapest way to improve the return.
How much electricity will my solar panels generate?
Between about 850 and 1,130 kWh per kWp per year depending on location, orientation, pitch and shading. Ask your installer for the Kk value and shade factor they used, which MCS requires them to provide.
Are solar panels a better investment than a heat pump?
Financially, usually yes. The margin on a heat pump against gas is thin and depends on good design. Solar has no equivalent failure mode: every unit you use displaces one you would have bought at 26.32p.
Do solar panels increase house value?
There is no reliable evidence that the installation cost is recovered in sale price. Treat any uplift as a bonus rather than part of the calculation.
Last updated 18 September 2026. Installed costs from our analysis of DESNZ Solar PV cost data, 2025/26 release. Generation methodology from MCS standard MIS 3002, which calculates estimated output as system size multiplied by the location Kk value and a shade factor. Kk ranges and regional figures are drawn from published MCS and Energy Saving Trust data. Import electricity prices from the Ofgem price cap for 1 October to 31 December 2026. Export rates are not capped or centrally published. All payback figures are our own calculations, with the assumptions stated, and exclude electricity price inflation and inverter replacement. Written by Ben Jardine.