
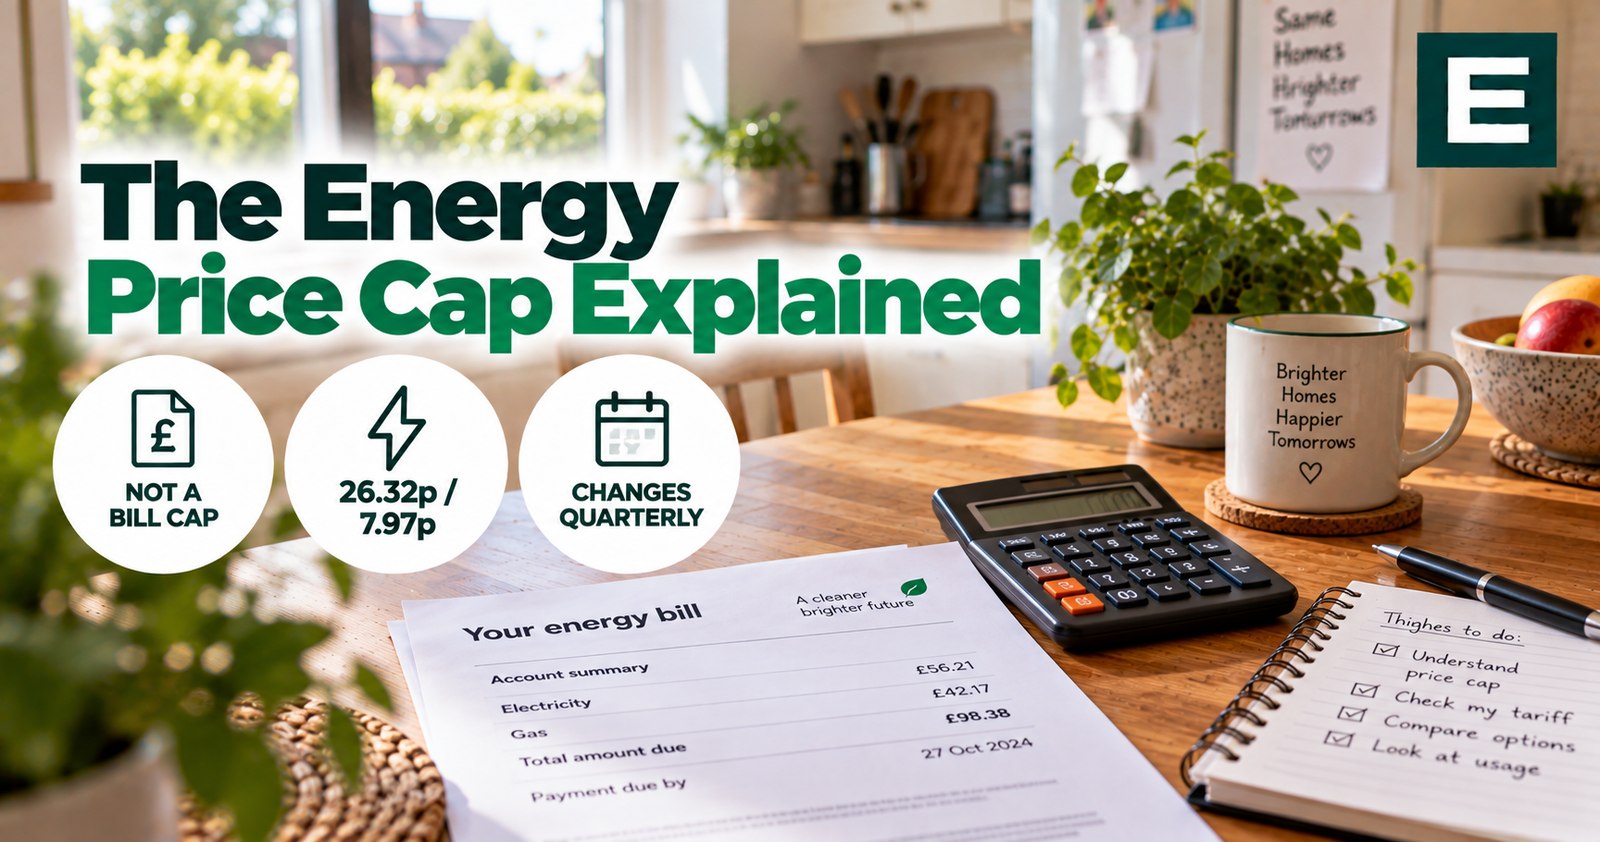
The energy price cap does not cap your energy bill. It caps the price per unit and the daily standing charge that a supplier can charge on a default tariff. Use more, pay more, without limit.
That distinction is the whole thing, and it is buried under a headline figure that gets reported as though it were a bill. This page explains what is actually capped, who it covers, and why the number you read in the news has stopped being comparable with the number from last year.
The headline figure, and what it actually means
From 1 October to 31 December 2026 the price cap is £1,723 a year, announced by Ofgem on 26 August 2026 and 4% higher than the previous period.
That £1,723 is not a maximum. It is what a household would pay if it used exactly the amount of energy Ofgem assumes a typical household uses. Ofgem calls that figure Typical Domestic Consumption Values. Use more and you pay more; use less and you pay less.
Ofgem attributes the increase to higher wholesale gas prices caused by the ongoing conflict in the Middle East, while noting that prices remain well below the height of the 2022 energy crisis, when the government limited bills to £2,500.
Why this year’s figure cannot be compared with last year’s
Two separate things broke comparability in 2026, and almost nobody reporting the cap mentions either.
The consumption basis changed. Ofgem revised its Typical Domestic Consumption Values, which are the assumed usage figures the headline number is built on. The effect is not small. The cap for July to September 2026 was £1,663 on the new basis and £1,862 on the old one, for the same quarter and the same prices. That is a difference of nearly £200 produced entirely by changing the assumption about how much a typical household uses.
VAT was removed from electricity. From 1 October 2026 to 31 March 2027 there is no VAT on electricity, though gas still carries 5%. Ofgem’s own guidance states plainly that costs cannot be compared directly to previous periods because of this change.
So when a headline says the cap rose 4%, it is comparing two quarters on a consistent basis. When it compares this year with two years ago, it is usually comparing two different things.
This is the clearest illustration on this site of why we date every figure we publish.
What is actually capped
Four numbers, two per fuel. These are the figures every running cost calculation on this site uses.
| 1 October to 31 December 2026 | Unit rate | Standing charge |
|---|---|---|
| Electricity | 26.32p per kWh | 54.83p per day |
| Gas | 7.97p per kWh | 29.7p per day |
Ofgem price cap, England, Scotland and Wales average for direct debit customers. Electricity excludes VAT for this period; gas includes 5% VAT. The rates you are charged depend on where you live, how you pay and what meter you have.
Dual fuel households therefore pay around 84.5p a day in standing charges before using a single unit of anything, or roughly £308 a year.
The standing charge, and where it goes
This is the most resented part of a bill and the least explained. It is a fixed daily charge covering the cost of maintaining the wires, pipes and cables that deliver energy to your door, along with the staff and systems needed to run an energy business.
For electricity, the House of Commons Library breaks it down like this:
- Just over 60% is network charges. That splits into 22.3p a day for the national high voltage transmission system and 11.6p a day for the regional distribution network.
- Just over a quarter is core operating costs and industry charges, including the cost of the smart meter rollout.
- The remainder covers other allowances, including the cost of supplier failures.
Gas standing charges contain no network charges at all, which is why they are roughly half the electricity figure.
Two movements worth knowing about. The transmission element of the electricity standing charge rose by 65% in the second quarter of 2026, almost 9p a day, to fund a large increase in the National Energy System Operator’s investment in the transmission network. And in October 2026 the electricity standing charge actually fell by 2.4p a day because of the VAT removal, while the gas standing charge rose by 0.7p.
The practical consequence for anyone reading this site: removing a gas supply entirely, rather than simply not using it, saves around £108 a year in standing charges. That matters when you are weighing up a heat pump, and we include it in the arithmetic on whether a heat pump is worth it.
Who the cap covers
You are covered if you are on a default or standard variable tariff and pay by direct debit, standard credit, or prepayment meter. Economy 7 customers are covered too.
You are not covered if you are on a fixed rate tariff. Your price is whatever you agreed, for the term you agreed it, and the cap has no bearing on it.
You are also not covered, in any meaningful sense, if you are on a time of use tariff. Those set their own rates, and the whole point of them is that the price varies by time of day. We look at what they are worth on our time of use tariffs page.
How it is set, and the rhythm of it
The cap is reset every three months, covering January to March, April to June, July to September, and October to December.
Ofgem announces each new level roughly six to eight weeks before it takes effect, which gives you a window to switch before it applies. The August announcement for the October quarter is the one that tends to make the news.
Each review averages wholesale energy prices over a period of roughly three months ending six to eight weeks before the announcement. That lag is why the cap is always describing the recent past rather than the present, and why it can rise in a quarter when wholesale prices are falling.
Wholesale costs are typically 35% to 50% of the cap. The rest is network costs, policy costs, supplier operating costs and a margin.
It is not one number
Two more things flattened out of most reporting.
The cap varies by region. Network costs differ across Great Britain, so a household in the North West pays different rates from one in the South East. Ofgem publishes the figures by area, and the figures on this page are the England, Scotland and Wales average.
It varies by payment method. Direct debit, standard credit and prepayment all carry different rates, reflecting what each costs a supplier to service.
So the £1,723 is an average of averages. Your own rates will differ, and they are on your bill.
What this means for the decisions on this site
Every calculation we publish depends on these four numbers, which is why we state them and date them on every page.
For heat pumps, the gap between the electricity rate and the gas rate is the whole argument. At 26.32p and 7.97p, with a boiler at 85% efficiency, a heat pump needs a real-world seasonal efficiency of about 2.8 to break even. If VAT returns to electricity in April 2027, electricity goes back to around 27.6p and that break-even rises to roughly 2.95.
For solar, the electricity rate is what every unit you generate and use is worth. A higher cap makes solar better, not worse.
For batteries, what matters is the gap between off-peak and peak, which the cap does not govern at all.
That is the useful way to read a cap announcement: not as a bill, but as a change to the gaps that decide everything else. We set that out on our energy bills page.
Frequently asked questions
These come up most often when the cap is announced.
Does the price cap cap my bill?
No. It caps the unit rate and the daily standing charge on a default tariff. If you use more energy you pay more, with no upper limit. The headline figure is what a household using Ofgem’s assumed typical amount would pay.
What is the current price cap?
£1,723 a year for a typical dual fuel household paying by direct debit, from 1 October to 31 December 2026. Electricity is 26.32p per kWh with a 54.83p daily standing charge, gas 7.97p per kWh with a 29.7p daily standing charge.
Why can’t I compare this year’s cap with last year’s?
Two changes broke comparability in 2026. Ofgem revised the typical consumption figures the headline is built on, and VAT was removed from electricity between October 2026 and March 2027. Ofgem states that costs cannot be compared directly with previous periods.
How often does the price cap change?
Every three months, taking effect on 1 January, 1 April, 1 July and 1 October. Ofgem announces each new level roughly six to eight weeks beforehand.
Am I covered by the price cap on a fixed tariff?
No. A fixed tariff sets your price for its term regardless of what the cap does. The cap applies to default and standard variable tariffs.
Why is the standing charge so high on electricity?
Just over 60% of it is network charges, covering the national transmission system and your regional distribution network. The transmission element rose by 65% in early 2026 to fund grid investment. Gas standing charges contain no network charges, which is why they are lower.
Last updated 20 September 2026. Price cap level, unit rates and standing charges from Ofgem’s published figures for 1 October to 31 December 2026, announced 26 August 2026. Standing charge composition and the transmission cost increase from the House of Commons Library research briefing on energy standing charges. Figures are the England, Scotland and Wales average for direct debit customers; rates vary by region, payment method and meter type. Electricity excludes VAT for this period and gas includes 5%. The cap is reset quarterly, so check the date above before relying on any figure here. Written by Ben Jardine.